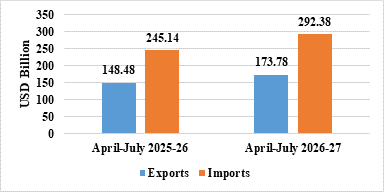
- The cumulative value of merchandise exports during April-July 2026-27 was US$ 173.78 Billion, as compared to US$ 148.48 Billion during April-July 2025-26, registering a positive growth of 17.04%
- The cumulative Non-Petroleum exports in April-July 2026-27 valued at US$ 143.61 Billion registered an increase of 12.79% as compared to US$ 127.32 Billion in April-July 2025-26
- Major drivers of merchandise exports growth in July 2026 include Petroleum Products, Electronic Goods, Engineering Goods, Organic & Inorganic Chemicals, and Cotton Yarn/Fabs./made-ups, Handloom Products etc
- Petroleum Products exports increased by 67.64% from US$ 4.13 Billion in July 2025 to US$ 6.92 Billion in July 2026
- Electronic Goods exports increased by 57.40% from US$ 3.76 Billion in July 2025 to US$ 5.92 Billion in July 2026
- Engineering Goods exports increased by 17.71% from US$ 10.40 Billion in July 2025 to US$ 12.24 Billion in July 2026
- Organic & Inorganic Chemicals exports increased by 14.39% from US$ 2.45 Billion in July 2025 to US$ 2.80 Billion in July 2026
- Cotton Yarn/Fabs./made-ups, Handloom Products exports increased by 8.40% from US$ 1.02 Billion in July 2025 to US$ 1.11 Billion in July 2026
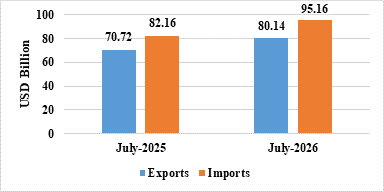
New Delhi. : India’s total exports (Merchandise and Services combined) for July 2026* is estimated at US$ 80.14 Billion, registering a positive growth of 13.31 percent vis-à-vis July 2025. Total imports (Merchandise and Services combined) for July 2026* is estimated at US$ 95.16 Billion, registering a positive growth of 15.83 percent vis-à-vis July 2025.
Table 1: Trade during July 2026*
| July 2026
(US$ Billion) |
July 2025
(US$ Billion) |
||
| Merchandise | Exports | 44.24 | 36.98 |
| Imports | 76.22 | 64.86 | |
| Services* | Exports | 35.89 | 33.74 |
| Imports | 18.94 | 17.30 | |
| Total Trade
(Merchandise +Services) * |
Exports | 80.14 | 70.72 |
| Imports | 95.16 | 82.16 | |
| Trade Balance | -15.03 | -11.43 |
* Note: The latest data for services sector released by RBI is for June 2026. The data for July 2026 is an estimation. (ii) Data for April-July 2025-26 has been revised on pro-rata basis using quarterly balance of payments data.
Fig 1: Total Trade during July 2026*
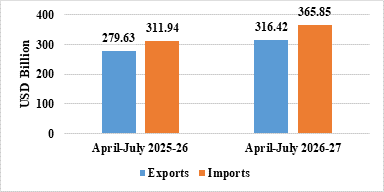
India’s total exports during April-July 2026-27* is estimated at US$ 316.42 Billion registering a positive growth of 13.16 percent. Total imports during April-July 2026-27* is estimated at US$ 365.85 Billion registering a growth of 17.28 percent.
Table 2: Trade during April-July 2026-27*
| April-July 2026-27
(US$ Billion) |
April-July 2025-26
(US$ Billion) |
||
| Merchandise | Exports | 173.78 | 148.48 |
| Imports | 292.38 | 245.14 | |
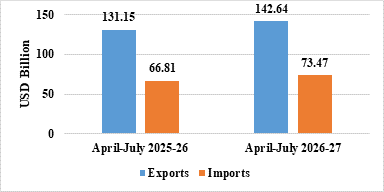
| Services* | Exports | 142.64 | 131.15 |
| Imports | 73.47 | 66.81 | |
| Total Trade
(Merchandise +Services) * |
Exports | 316.42 | 279.63 |
| Imports | 365.85 | 311.94 | |
| Trade Balance | -49.43 | -32.32 |
Fig 2: Total Trade during April-July 2026-27*
MERCHANDISE TRADE
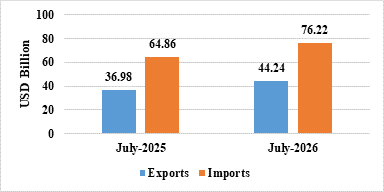
- Merchandise exports during July 2026 were US$ 44.24 Billion as compared to US$ 36.98 Billion in July 2025.
- Merchandise imports during July 2026 were US$ 76.22 Billion as compared to US$ 64.86 Billion in July 2025.
Fig 3: Merchandise Trade during July 2026
- Merchandise exports during April-July 2026-27 were US$ 173.78 Billion as compared to US$ 148.48 Billion during April-July 2025-26.
- Merchandise imports during April-July 2026-27 were US$ 292.38 Billion as compared to US$ 245.14 Billion during April-July 2025-26.
- Merchandise trade deficit during April-July 2026-27 was US$ 118.60 Billion as compared to US$ 96.66 Billion during April-July 2025-26.
Fig 4: Merchandise Trade during April-July 2026-27
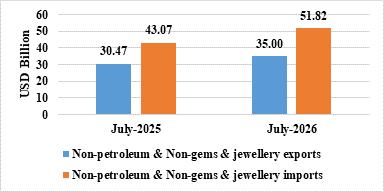
- Non-petroleum and non-gems & jewellery exports in July 2026 were US$ 35.00 Billion compared to US$ 30.47 Billion in July 2025.
- Non-petroleum, non-gems & jewellery (gold, silver & precious metals) imports in July 2026 were US$ 51.82 Billion compared to US$ 43.07 Billion in July 2025.
Table 3: Trade excluding Petroleum and Gems & Jewellery during July 2026
July 2026(US$ Billion) |
July 2025 (US$ Billion) | |
| Non- petroleum exports | 37.32 | 32.86 |
| Non- petroleum imports | 57.91 | 49.30 |
| Non-petroleum & Non-Gems & Jewellery exports | 35.00 | 30.47 |
| Non-petroleum & Non-Gems & Jewellery imports | 51.82 | 43.07 |
Note: Gems & Jewellery Imports include Gold, Silver & Pearls, precious & Semi-precious stones
Fig 5: Trade excluding Petroleum and Gems & Jewellery during July 2026
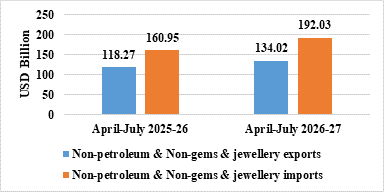
- Non-petroleum and non-gems & jewellery exports in April-July 2026-27 were US$ 134.02 Billion, compared to US$ 118.27 Billion in April-July 2025-26.
- Non-petroleum, non-gems & jewellery (gold, silver & precious metals) imports in April-July 2026-27 were US$ 192.03 Billion, compared to US$ 160.95 Billion in April-July 2025-26.
Table 4: Trade excluding Petroleum and Gems & Jewellery during April-July 2026-27
April-July 2026-27(US$ Billion) |
April-July 2025-26
(US$ Billion) |
|
| Non- petroleum exports | 143.61 | 127.32 |
| Non- petroleum imports | 213.46 | 180.33 |
| Non-petroleum & Non Gems & Jewellery exports | 134.02 | 118.27 |
| Non-petroleum & Non Gems & Jewellery imports | 192.03 | 160.95 |
Note: Gems & Jewellery Imports include Gold, Silver & Pearls, precious & Semi-precious stones
Fig 6: Trade excluding Petroleum and Gems & Jewellery during April-July 2026-27
SERVICES TRADE
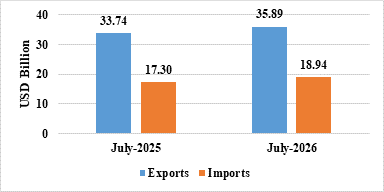
- The estimated value of services export for July 2026* is US$ 35.89 Billion as compared to US$ 33.74 Billion in July 2025.
- The estimated value of services imports for July 2026* is US$ 18.94 Billion as compared to US$ 17.30 Billion in July 2025.
Fig 7: Services Trade during July 2026*
- The estimated value of service exports during April-July 2026-27* is US$ 142.64 Billion as compared to US$ 131.15 Billion in April-July 2025-26.
- The estimated value of service imports during April-July 2026-27* is US$ 73.47 Billion as compared to US$ 66.81 Billion in April-July 2025-26.
- The services trade surplus for April-July 2026-27* is US$ 69.17 Billion as compared to US$ 64.35 Billion in April-July 2025-26.
Fig 8: Services Trade during April-July 2026-27*
- Exports of Iron Ore (78.35%), Petroleum Products (67.64%), Electronic Goods (57.4%), Meat, Dairy & Poultry Products (40.84%), Cashew (25.11%), Marine Products (17.83%), Engineering Goods (17.71%), Handicrafts Excl. Hand Made Carpet (15.55%), Organic & Inorganic Chemicals (14.39%), Plastic & Linoleum (11.01%), Cereal Preparations & Miscellaneous Processed Items (9.51%), Cotton Yarn/Fabs./Made-Ups, Handloom Products Etc. (8.4%), Mica, Coal & Other Ores, Minerals Including Processed Minerals (5.79%), Drugs & Pharmaceuticals (0.74%), and Man-Made Yarn/Fabs./Made-Ups Etc. (0.45%) recorded positive growth during July 2026 over the corresponding month of last year.
- Imports of Silver (-66.1%), Sulphur & Unroasted Iron Pyrts (-47%), Newsprint (-26.31%), Pulp And Waste Paper (-22.61%), Medcnl. & Pharmaceutical Products (-3.96%), Wood & Wood Products (-2.1%), and Iron & Steel (-1.84%) recorded negative growth during July 2026 over the corresponding month of last year.
- Services exports is estimated to grow by 6.38 percent during April-July 2026-27* over April-July 2025-26.
- Top 5 export destinations, in terms of change in value, exhibiting positive growth in July 2026 vis a vis July 2025 are U S A (12.85%), China P Rp (64.57%), Singapore (83.7%), Kenya (151.41%), and Malaysia (73.03%).
- Top 5 export destinations, in terms of change in value, exhibiting positive growth in April-July 2026-27 vis a vis April-July 2025-26 are Singapore (97.11%), China P Rp (35.97%), Tanzania Rep (131.2%), South Africa (69.75%), and Sri Lanka Dsr (111.76%).
- Top 5 import sources, in terms of change in value, exhibiting growth in July 2026 vis a vis July 2025 are Russia (83.85%), China P Rp (34.42%), Oman (150.36%), Taiwan (111.3%), and U S A (18.11%)
- Top 5 import sources, in terms of change in value, exhibiting growth in April-July 2026-27 vis a vis April-July 2025-26 are Russia (59.65%), China P Rp (29.68%), Oman (200.68%), U S A (22.42%), and Brazil (166.84%).